NHL Schedule Genetic Algorithm
NHL Schedule Genetic Algorithm
This project is a genetic algorithm that I built to generate optimized NHL regular season schedules under a variety of real-world constraints. It started as my final project for an Evolutionary Computation course at St. Francis Xavier University, which concluded with a 40-minute formal presentation, and I've continued developing it since. The full source code and documentation are available on my GitHub, and you can download the presentation slides I used during that talk (they were used as a visual aid and do not represent a full transcript).
A genetic algorithm is an optimization technique loosely inspired by natural selection. It starts with a large batch of random candidate solutions (here, full season schedules), scores each one on how good it is, and repeatedly combines and lightly tweaks the best-scoring ones to produce a new batch. Over many rounds, called generations, the population gradually improves until it converges on a strong solution. For anyone who wants to learn more about genetic algorithms in general, Wikipedia is a good place to start.
A good schedule has to balance the interests of three groups: fans want games on a regular basis and want to see teams playing at their best, players and staff want manageable travel and enough rest between games so they can perform at their best, and the league and its teams want strong TV ratings, ticket sales, and lower travel costs. Rather than solving it by hand or brute force, this project treats it as an evolutionary search problem.
A full NHL season schedule is a hard optimization problem: 32 teams, 1,344 games (84 per team, split 42 home and 42 away), running from a set start date to a set end date, all while trying to keep travel manageable, avoid teams playing twice in a day or for more than two days in a row, and spread out home and away stretches.
Created Schedules
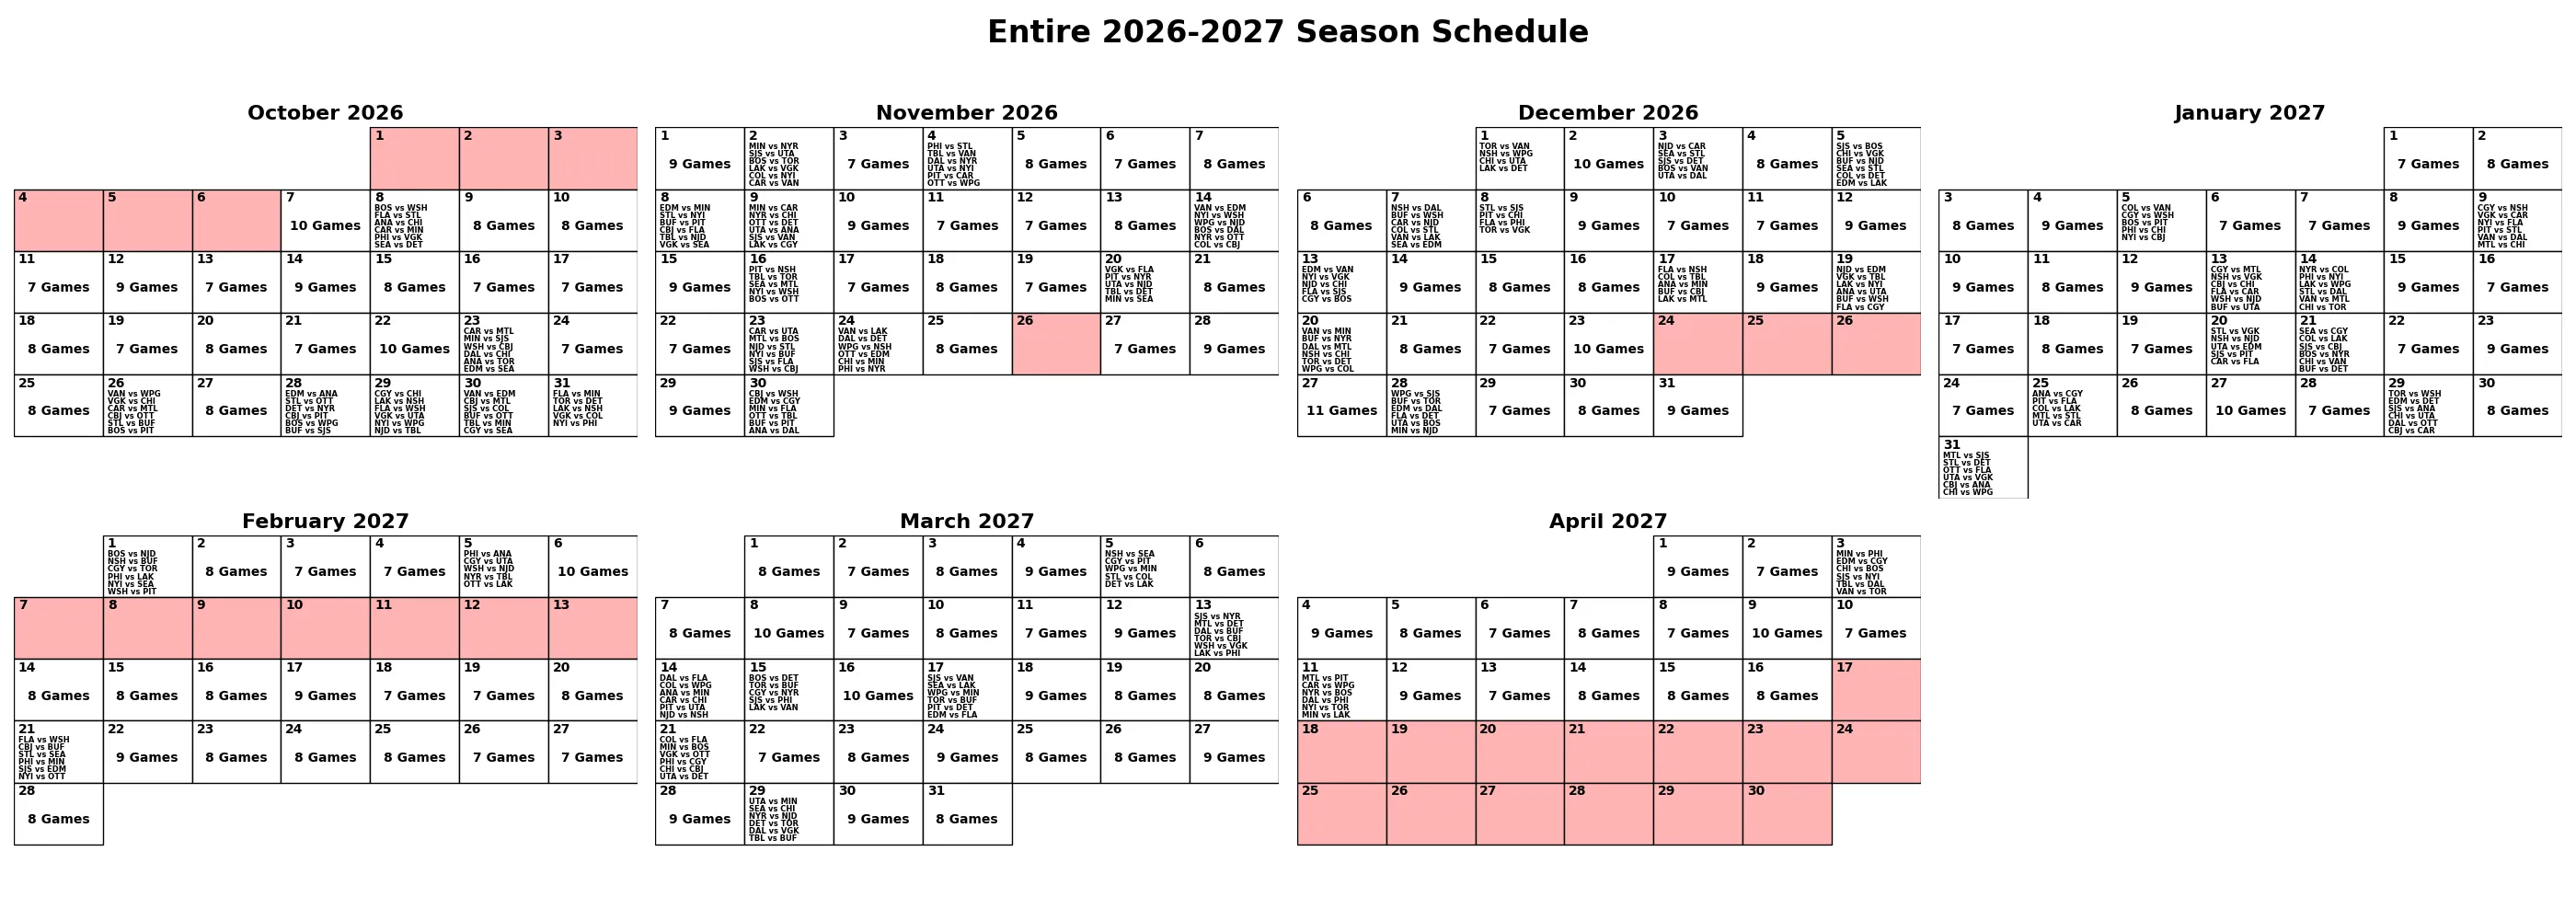
Below is the best schedule my most recent run found. You can pick a team to see its individual schedule, or view the entire league's schedule at once. Shaded days are days with no games league-wide (American Thanksgiving, the Christmas break, and the All-Star break). For the entire league's schedule, if a day has more than 6 games scheduled, due to space, only the number of games will be shown. For the team schedules, home games are in blue and away games are in red.
This project was completed in December 2025, before scheduling details were announced for the actual 2026-2027 season, so assumptions were made for the start and end dates, as well as which days could have no games scheduled on them.
The Genetic Algorithm
Each candidate schedule (chromosome) is represented as a list of days across the season, with each day holding the game IDs scheduled for it. A multi-objective fitness function scores every team's schedule on three things: rest and game-day balance, home/away streak balance, and total travel distance (calculated between arena coordinates using the Haversine formula). Two rules are treated as hard constraints rather than soft preferences: no team can play twice in one day, and no team can play three days in a row. Any schedule that violates either gets a massive fitness penalty, so the algorithm is pushed to eliminate them entirely rather than just discourage them.
The algorithm itself uses tournament selection, order crossover, three mutation operators (game swap, day swap, and day inversion), and elitism. If the population's best fitness stagnates across generations for long enough, the crossover rate is halved, the mutation rate is increased by half, and day-inversion mutation is temporarily disabled to encourage smaller, less destructive changes late in a run (these changes revert if the best fitness starts improving again).
Hyperparameter Tuning
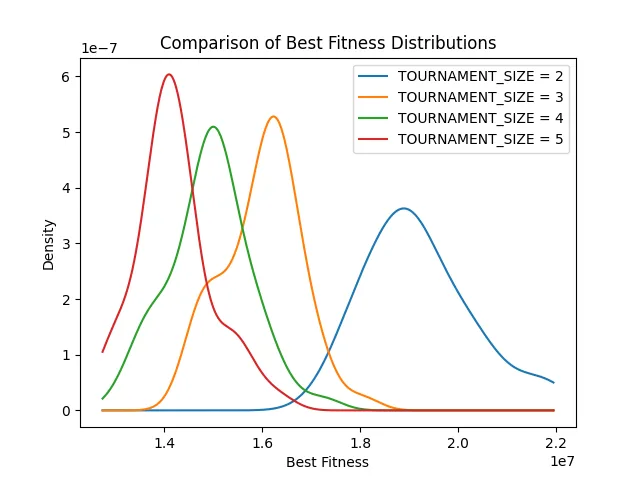
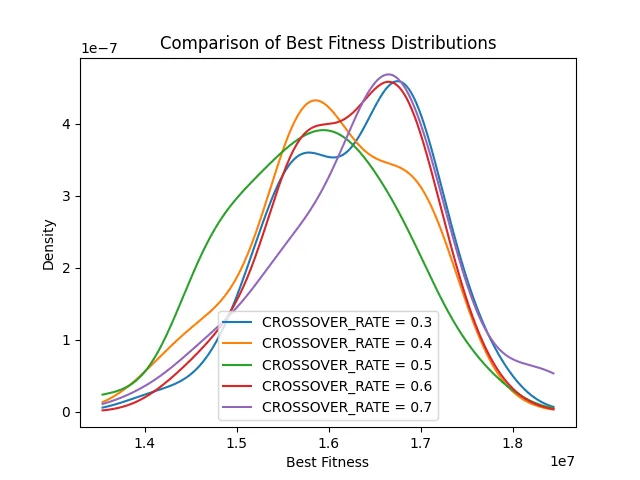
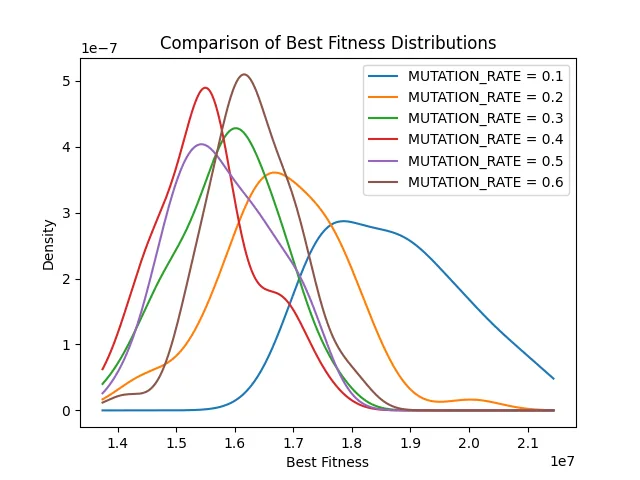
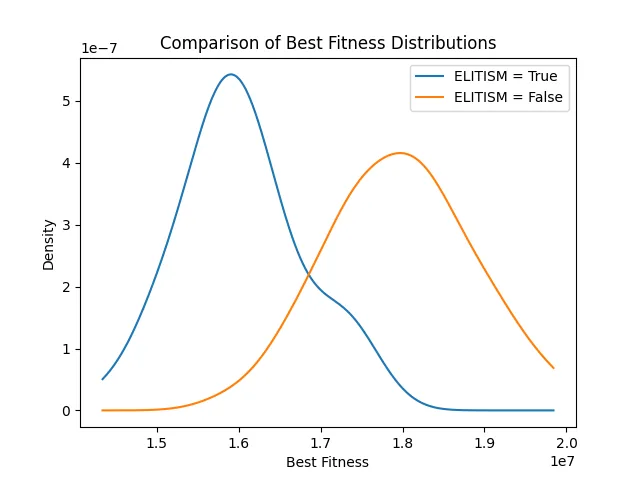
Before settling on the production configuration, I tested each hyperparameter individually against a fixed baseline, running the algorithm 50 times per value and comparing the resulting distributions of best fitness found. The plots below show those distributions for tournament size, crossover rate, mutation rate, and elitism.
One notable case is tournament size. The sweep favored a larger tournament size (5), but I went with a smaller size of 3. The hyperparameter tests only ran 300 generations per test, and a smaller tournament size (more exploration, less selection pressure) tends to matter most in those early generations, so I suspect the sweep's preference for a larger tournament size is biased toward what works early rather than what's best across a full 20,000 generation run.
The final run uses a population of 500, a tournament size of 3, a crossover rate of 0.40, a mutation rate of 0.40, elitism enabled, and ran for 20,000 generations. Note that the effective crossover and mutation rates end up a little lower in practice, since either operation can abort and leave a schedule unchanged if it can't find a valid slice or day range.
Performance
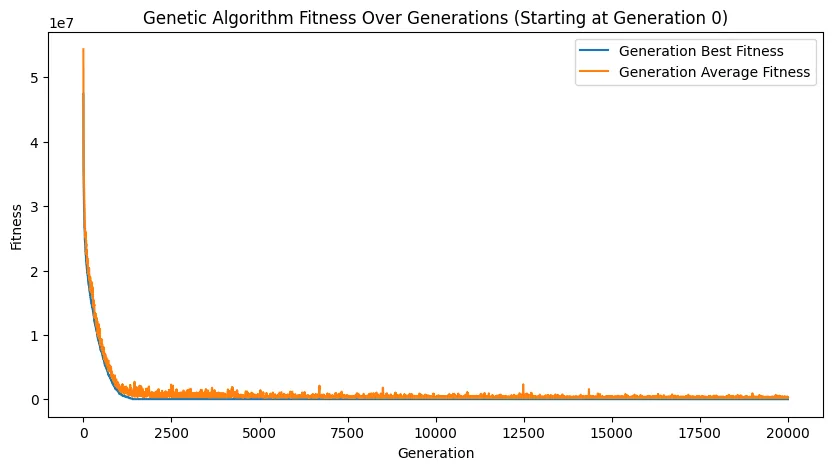
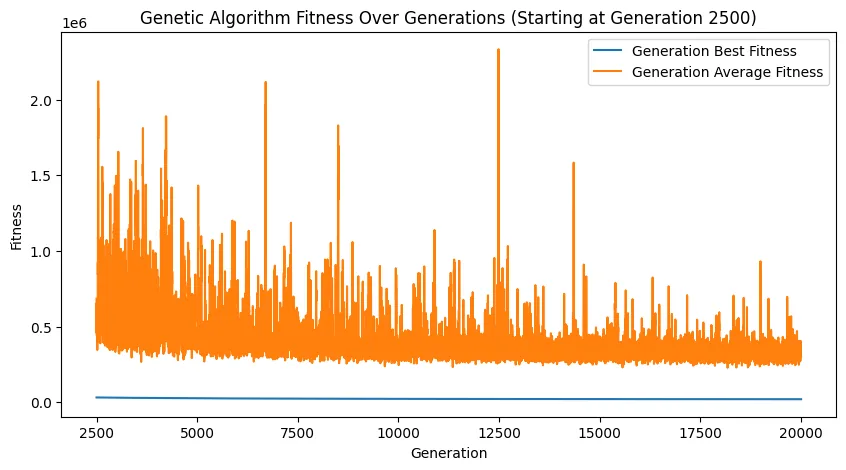
Starting from a randomly generated population with a best fitness of roughly 47.4 million, this run reached a final best fitness of 20,397.49 after about 8 hours of runtime (lower is better, and every team's schedule cleared the hard-constraint checks of playing twice on the same day or playing on three days in a row). The plot on the left shows the best and average fitness of the full 20,000 generation run and the plot on the right starts at generation 2,500, where most of the remaining improvement is fine-tuning rather than the sharp early drop.
I'm aware the real NHL schedule has to satisfy a lot more constraints than this project accounts for, venue availability especially, since many arenas are shared with other businesses and events other than hockey. But for what I set out to optimize here, rest and game-day balance, home/away streak balance, and total travel distance, I think the results came out well.