The Analytics With Avery Blog
The Offensive Value of Assists Compared to Goals
By Avery Doiron | May 14, 2025
Introduction
It should come as no surprise that points are often viewed as the main indicator of an NHL player's offensive skill. Players earn a point by scoring a goal, by passing to the goal scorer (the primary assist), or by passing to the player who passed to the goal scorer (the secondary assist). Since the ultimate objective in hockey is to win by outscoring the opponent, goals are clearly critical. But just how important are the passes that come before them? That's what I wanted to know.
I'm currently developing a model to rank player attributes using weighted stats, with the goal of identifying which players excel in specific areas like shooting, playmaking, and overall offense. To do this properly, I needed to figure out how valuable assists are relative to goals. For simplicity, goals were assigned a baseline weight of 1.00, but I wasn't sure what to make assists. Should assists be weighted the same as goals at 1.00? Maybe 0.50 for all assists. But those weightings don't reflect the difference between a primary and a secondary assist. Perhaps 0.50 and 0.25 respectively? These different weights affected the order of my rankings heavily, so I really wanted to get an answer that was as accurate as possible.
After searching online, I found there really wasn't much information on this topic. Sure there are debates on how much assists should be worth, but no actual research done when it comes to the numbers people throw out. That is, until I found a post made in 2014 by Tyrel Stoakes. He sought to answer the same question I've been wondering and he came up with a great methodology to tackle it. With his methods, he found that primary assists were worth 54% of a goal, and secondary assists were worth 19% of a goal. While these values seemed reasonable, I wanted to test them myself using more recent data and a few tweaks to his methodology.
Methodology
I collected 5-on-5 player data from NaturalStatTrick over 6 of the last 7 seasons, the 2020-2021 season was left out to avoid irregular data and the smaller sample of games due to the season being shortened as a result of the COVID-19 pandemic. In Tyrel's post, he chose a sample of players who played over 300 even-strength minutes in every season from 2007-2010. I wanted to examine how the results changed as the sample size changed. So I ran multiple tests while varying the minimum time on ice (TOI) requirement from 0 to 800 minutes, incrementing by 100 after each execution. The goal was to determine the optimal TOI threshold first, and then use it to yield the most predictive results.
Following Tyrel's process, I started by defining a goals created (GC) metric, to represent how much a player contributes to the creation of goals over a season. The formula used to calculate this is: $$ GC = Goals + (Assists_P \times Weight_P) + (Assists_S \times Weight_S) $$ To account for player's time on ice (TOI) differences, I converted this to a rate stat: $$ GC/60 = \dfrac{GC}{TOI} \times 60 $$
During each test, for every player who met the TOI requirement, I averaged their GC/60 over the first four seasons and used that value to predict their GC/60 over the final two seasons. To estimate the optimal weights of primary and secondary assists, I conducted a grid search, testing all combinations of assist weights from 0.00 to 1.00 in increments of 0.02. For those unfamiliar, a grid search involves systematically testing many combinations of values to identify the set that produces the best model fit, in this case, the highest R² value between predicted and actual GC/60. After running the search, the assist weight combination that produced the highest coefficient of determination (R²) was interpreted as the most predictive and therefore the best estimate of assist value relative to goals.
Results
Below I plotted the R² values produced by each TOI-based sample. The green line in the graph shows the highest R² value found by the optimum assist weights from each test through the grid search. For comparison, I also plotted the R² results for when the primary and secondary assist weightings were both 0.00, 0.50, and 1.00, represented by red, orange, and yellow lines, respectively. As you can see, the best found assist weights, always gave a higher R² than the other commonly used assist weightings.
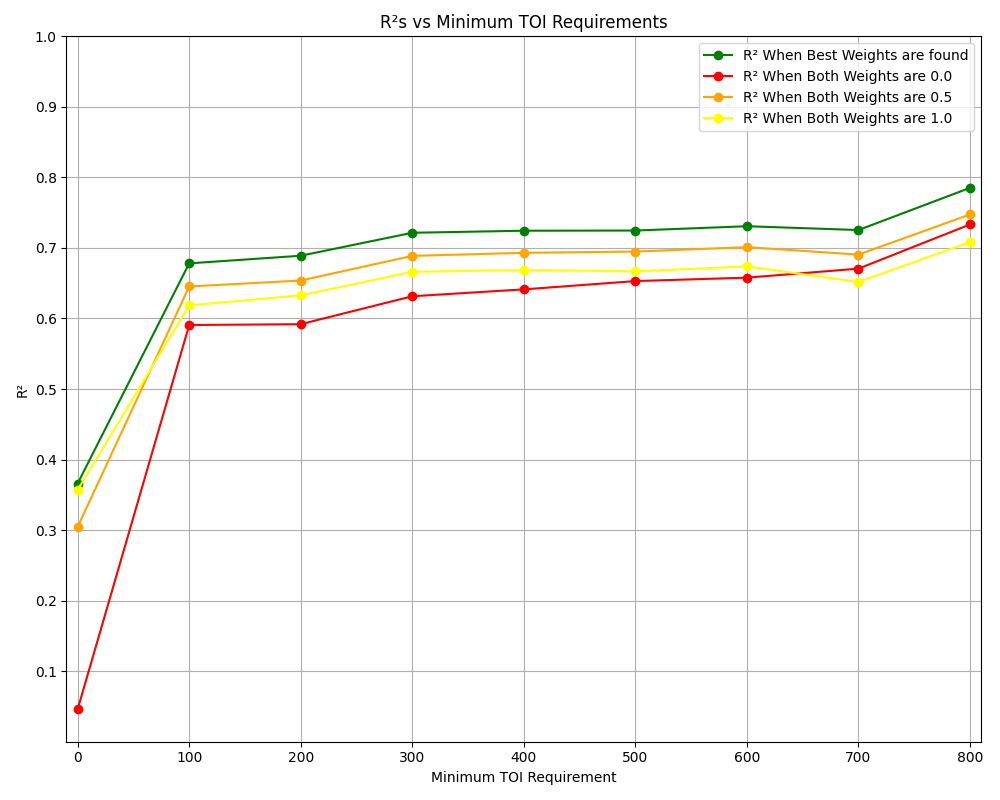
To determine which sample size to use for deriving the final assist weights, I wanted a balance between a strong R² and a large sample of players. The 0-minute TOI requirement was discarded early, as it included too many players with minimal ice time leading to atypical data, which resulted in an unacceptably low R². On the opposite end, the 800-minute filter limited the player pool to just 125, which felt like too small of a sample size, especially with other TOI-filtered samples having closer to 200-300 players.
As shown in the graph, we can see that R² rises from the 100-minute to the 300-minute TOI minimum sample where it then starts to level off until the 800-minute TOI sample (which we previously discarded from using as the best sample). After the 300-minute TOI threshold, the increase in R² becomes very minimal, while the sample size continues to decrease. I think it's safe for the minimum TOI requirement to be 300 minutes as it yields a good R² while maintaining a large sample size of 289 players. This also coincides with Tyrel's post, as he also chose 300 minutes to be the TOI threshold for his study. With the sample of players selected, we can now use them to find the optimal assist weights.
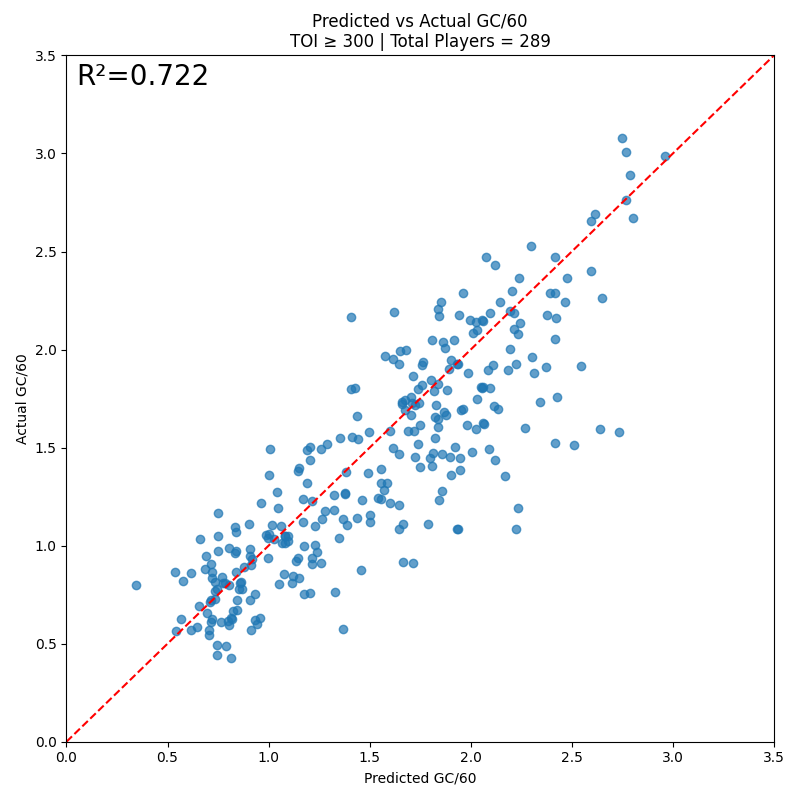
Above is a scatter plot of the predicted GC/60 vs the actual GC/60, with both metrics calculated using the optimal weights found through the grid search. The value of R² came out to be 0.722. Considering how volatile a player's stats can be by season, I was pretty happy with this value. So what were the assist weights that led to this R²?
The results showed that the best-performing weight for primary assists was 0.78, meaning each primary assist contributes about 78% as much as a goal when it comes to predicting future goal creation. This value is higher than Tyrel Stoakes’ original estimate of 0.54, though both studies affirm that primary assists hold significant value in offensive contributions.
Where things got more interesting was with secondary assists. The optimal weight found for secondary assists was 0.00, suggesting that, on average, they provide little to no predictive value for future offensive production. While Tyrel’s study assigned them a value of 0.19, he did note that the value of secondary assists tends toward zero, especially for forwards.
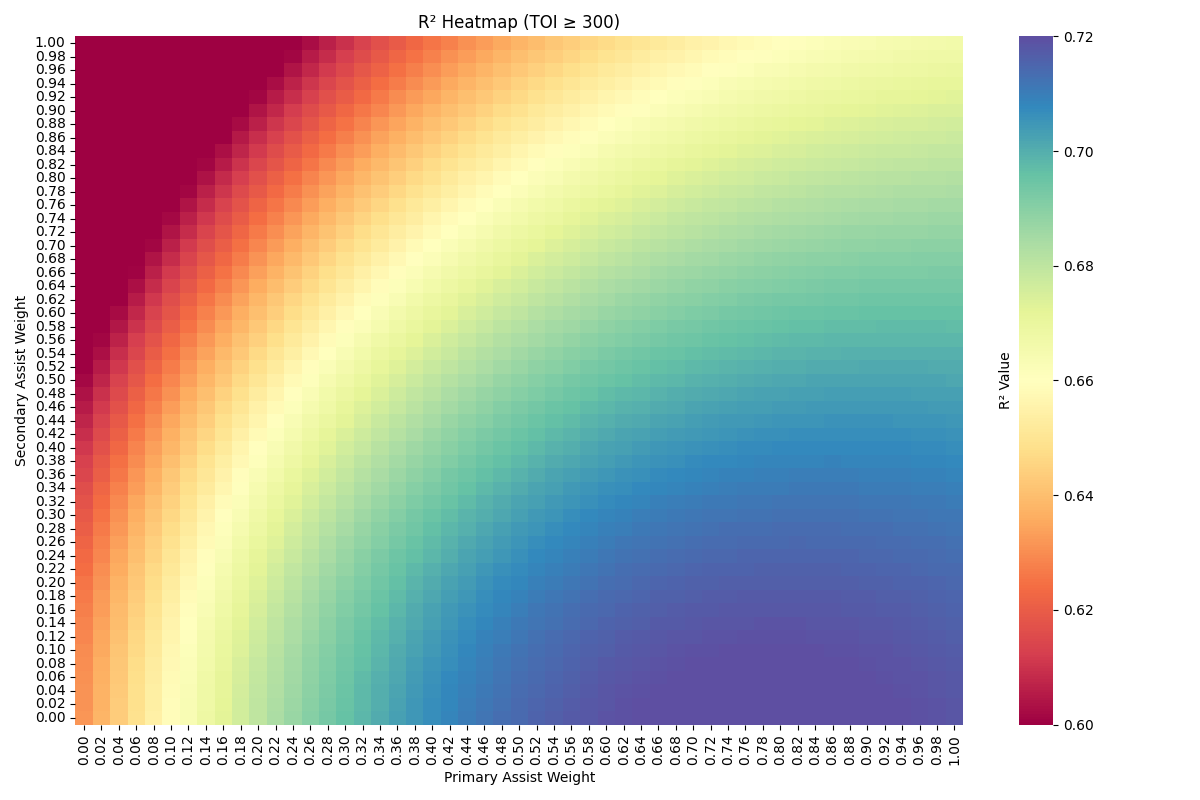
The heat map above visualizes the R² values produced by each combination of primary and secondary assist weights tested in the grid search. The cooler colors (purples, blues, and greens) represent higher R² values, indicating better model performance, while warmer colors (reds, oranges, and yellows) reflect weaker fits. As shown, the highest R² values cluster around the primary assist weights between 0.70 and 0.90, while the secondary assist weight hovers near 0.00 across the best-performing combinations. This reinforces the earlier result that primary assists carry stronger predictive value, while secondary assists do not appear to improve model performance and may even introduce noise when weighted too heavily.
Conclusion
Based on the results from my adapted methodology inspired by Tyrel Stoakes, primary assists appear to be worth about 78% of a goal, while secondary assists don’t show meaningful value in predicting future offensive production, being worth 0% of a goal. That doesn’t mean every secondary assist is meaningless though. Some are genuinely key to setting up goals. However, the same could be said for the pass before the secondary assist, and those aren't rewarded with a point on the score sheet. What this methodology suggests is that secondary assists are not a strong indicator of a player's offensive ability. It’s possible that secondary assists (and even primary assists) carry more value for defensemen than forwards, as Tyrel alluded to, but that’s something that will have to be explored in future work.
Is this methodology a perfect way to determine the objective worth of assists? Not entirely. But I believe it provides a pretty good sense of how different types of assists contribute to offense over time. This experiment could potentially be improved by adding more variables into the mix, using more seasons' worth of data, or as mentioned before, comparing how results differ from forwards to defensemen. Despite these limitations, I think this experiment offers a solid starting point for understanding the offensive value of assists. With more data and a few tweaks, future work could build on this and provide even clearer answers.
Big thanks to Tyrel Stoakes for the inspiration behind this post, and to NaturalStatTrick for the data used in the analysis. If you're interested in checking out the code behind this project, you can find it on my GitHub. Finally, thank you, the reader, for checking out this blog post. If you enjoyed the post, have feedback, or want to see more, feel free to reach out or follow along on my socials.